Google Analytics for Webcomics
I was recently talking to some comic creator friends on Twitter about using Google Analytics to evaluate website statistics, numbers, pageviews and etc. GA is a very powerful tool, but the sheer size of it, with all its custom variables, settings, options and etc, can be off-putting and scary. I know some people who just click on a couple of graphs, see some numbers, and then shrug because they don’t know what to do with it. Well, I’m not an expert, but I do have enough experience that I feel comfortable giving a basic primer.
Also, in forewarning, I’m going to be using screenshots from my GA page, so if me sharing my site statistic numbers will make you weird and/or sad by comparing to mine, don’t look at them 😛
EDIT: We’ve since found and corrected a double pageview counting glitch, so pageviews are up to twice as high, as are pages/session, and bounce rate %s are HORRIBLY off. I’ll replace the images once we have enough non-glitchy data.
Intro and Set Up
Google Analytics is a robust site statistics packaged offered by our digital overlords. If you don’t have one, it’s pretty simple to set one up. In fact, you can probably google it 😉 But basically, you create your account, get a unique code for your site which you then insert into the back end settings. Once it is activated it starts keeping track of visits to your site, gathering all sorts of useful data that we will shortly get in to 🙂
Before we do, if you want to prevent GA from keeping track of your personal visits to your website (obsessively checking things, etc, like we do), you can actually set it up to not record visits from your IP of choice. This is also a good thing to do if you keep getting annoying spam visits from foreign countries skewing your numbers.
The Basics
Alright, time to get into some examples of how GA can work for you. I’m going to assume you already have GA set up and installed, so that you can follow along.
Go ahead, this will still be here when you’re done.
Ok, ready? Good. Lots of pictures with crappy arrows and stuff drawn on them by me, coming up!
There are two basic graphs that most people like to use: the Real-Time Overview and the Audience Overview. These are easily accessible by clicking on the aforementioned tabs in the menu to the left of your GA screen.
Real-Time

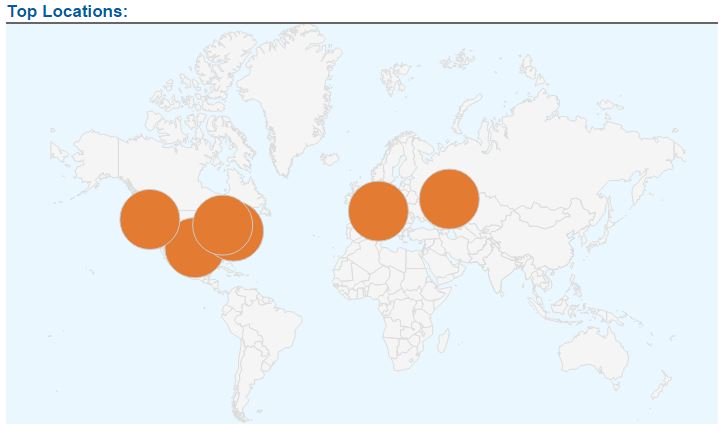
As you can see, more than anything else this is a fun tool. You can see how many people are currently on your site, where they came from (referrals, social traffic, keyword search terms) what page they’re on, and how many page views in the past 30 minutes. If you scroll down a little bit, you can see my favorite GA creepy stalker game: where people are visiting from.
While Real-Time analysis is fun, it isn’t the most useful for us because the amount of traffic we’re getting at any one moment is fairly low.
The Audience Overview is very useful, though.
Audience Overview

Again, crappy red arrows showing you where to click. This graph shows you a summary of visits, page views, and more, over a customizable date range, looking at daily, weekly or monthly time intervals (and hourly too, but most of us aren’t getting enough hits to worry about that). I’ve chosen to look at Users (defined as unique visitors in that time interval) and Pageviews here, but you can also look at Sessions (all visits in the time interval, including repeat visitors), % New Sessions, and more. If you scroll down, you can see all of that data summarized for the date range.

These 2 graphs are the main basic graphs that most creators are familiar with, and are very useful. GA has some extra useful goodies you can find and settings you can use to provide you even more interesting and helpful information on your readership.
Digging Deeper
First, there are some extra goodies still in the Audience Overview tab.
If you scroll a littler father down from where we just were, you’ll see a section that looks like this:
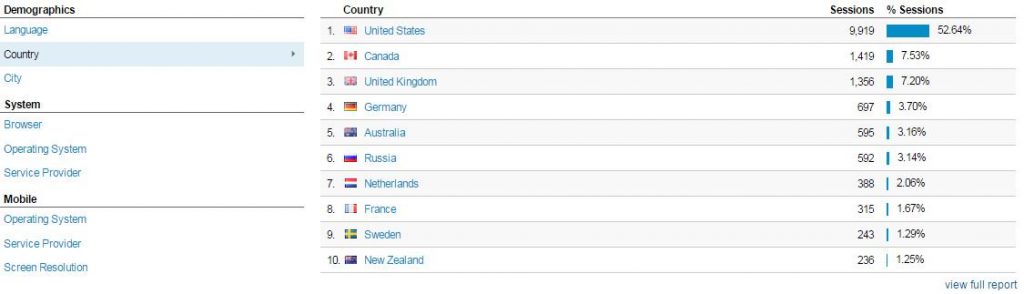
Here, by clicking on any of the subsections on the left, you can get the Sessions data broken up into subgroups. Above I show the subdivision by country the session originates from. On a more technical side, you can see the percentage of your readers using a certain browser, OS, etc, if you want to try to code your site to work best for them.
Date Comparison
Alright, if you scroll back up, we can get some more good information from the Audience Overview graph, by comparing two separate date ranges.
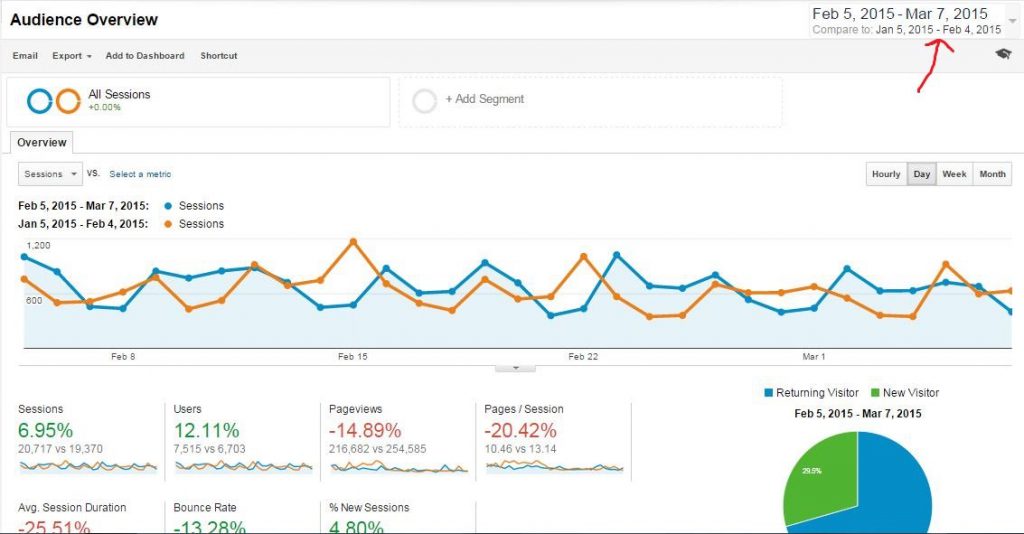
If you select up where I drew my crappy arrow, you can choose which date ranges to compare. You can still choose which data to compare (showing Sessions, above) and whether to measure by day or week, etc, all as before, now just comparing between these two date ranges.

This can be a very powerful tool to measure your growth. Pick a key indicator (I recommend Users, as dedicated readers are more important to me, with a story comic, then getting many thousand page views from a successful reddit link once), a time frame to compare to in the past, and see how you’ve grown. Always a nice boost if I’m feeling unhappy with my recent stats.
Active Users
Similar to that, under Audience there is also a subsection called Active Users. While still in Beta, it provides a similar sort of useful information, measuring the number of unique visitors who’ve come and interacted on your site at least once during the indicated date range.

Useful, but you’ll see occasional huge peaks from 1 really good day in that measure week (good reddit days, for me, probably).
Acquisition
Moving on from Audience, let’s check out Acquisition. This section has TONS of detailed data about where your website visitors are coming from. It’s a gold mine of information. You can do all the same sort of comparisons as I explained before in the Audience tab. Right here though I want to show you a simple bit of interesting and useful info.
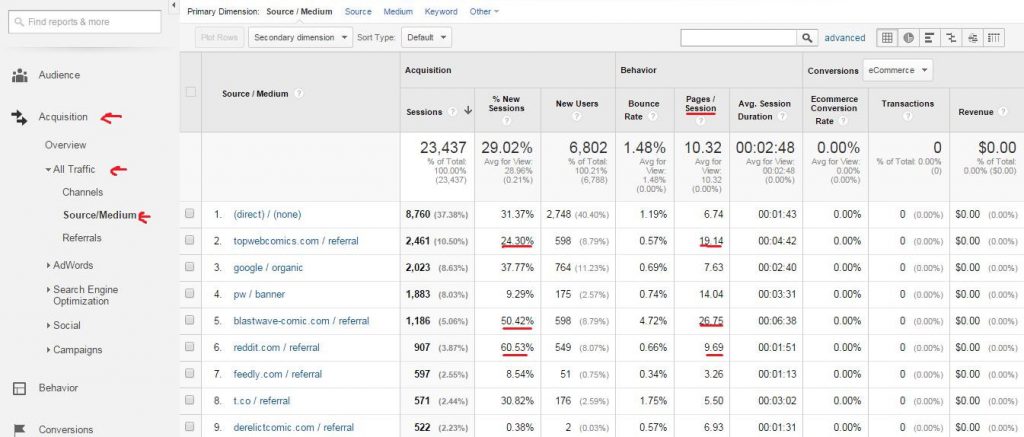
I’ve underlined 3 different traffic sources to compare: Top Webcomics, reddit, and a comic I advertised on with Project Wonderful. Comparing % New Sessions and Pages/Session:
- You can see that on TWC, I’m actually getting mostly returning visitors who are coming back to catch up on Demon Archives, as well as a good number of new users. The greater number of returning users brings the Pages/Session average down, but that’s ok, because they’re coming back to read a couple pages, and it means that the new users are probably reading most of the archive.
- On reddit, a larger percentage of the visits that come are new users, but the Pages/Session is way down. This tells me that posting there may grab a good number of clicks, but they in general don’t really stick around as much. Because of this, posting heavily on reddit has never really been my priority, especially since they prefer humor and gag comics over longform story comics.
- Targeted Project Wonderful ads are a little bit of the best of both. They can bring in a lot of visitors (new AND returning) who often read a lot of pages. I’ve advertised on that comic before, but posting an ad there again got a lot of people who had read some and forgotten to give us another try, which is awesome.
This is just the surface of what you can find in Acquisition. By clicking on one of the sources, you can get more in depth information. In the example below, I selected the TWC entry, and then created a secondary dimension to sort it by Landing Page.

This shows a couple of cool things.
- Entry #1 shows readers coming from TWC just by clicking on my entry since we were ranked in the Top 100 this month. A good number of new readers, as well as returning ones. Cool stuff, you should make an entry and promote it for higher rankings. But that’s a different article maybe someday.
- Entry #2 is actually the landing page I had my TWC adsquare directed at. Most of those hits were new visitors because of the ad I had placed, and you can see that they read a lot of pages when they came. TWC is a great source for comic readers who like longform story comics.
- Entry #3 and the rest of the 0% new readers entries actually point on something kind of weird with GA that I’m unsure about. There is no link on TWC that directs to these landing pages. This leads me to believe that these visitors ORIGINALLY found my site from TWC, but during the period measured came back to the site and landed on these pages and read some more. If this is true (and it’s the only thing that makes sense), it actually means that many of the “returning visitors” we’re seeing in the Acquisition tab aren’t necessarily coming back by clicking on a link from the source website listed, just that that’s where they first found you, and have since come back. Maybe. Either way, they’re back, and that’s how they found you to begin with, so it’s good stuff.
Ads, Campaigns and Custom URLs
To try to clarify out some of the confusion about where visits are coming from, you can actually create custom URLs that allows GA to measure those visits specifically and easily. This is a great thing to with ads in order to more easily analyze how effective they are.
A lazy way of this is to just add your own tag to the end of your URLs when you link somewhere, like this: https://demonarchives.net///?ref=GA_blog_example
The ? in the url makes everything after it be ignored for the purposes of directing you to the website (try it out!), but what it does do is allow you to use the “Secondary Dimension-> Landing Page” trick I taught you above to sort out to see which visits from a particular source are clicks from your ad. I did this with the PW ad I mentioned before, and you can see below what that looks like.

A better way to do this that utilizes systems built in to GA is to use Google’s URL Builder to create a campaign with a custom URL, and then track it in the Campaigns section of GA. If you visit this link, all you have to do is enter your URL you want to link, add a couple of terms like “campaign name” and etc, click submit, and it will give you a long complicated looking URL, but one that plays nicely with GA. Here’s an example: https://demonarchives.net///?utm_source=Blog&utm_medium=link&utm_campaign=GA%20Blog%20Example
While a little unwieldy, using this tool can make it easy to evaluate the success of your campaigns. Under the Acquisition tab, select Campaigns -> All Campaigns. I used this tool to create the URL for a couple of different Project Wonderful campaigns, which I show below.
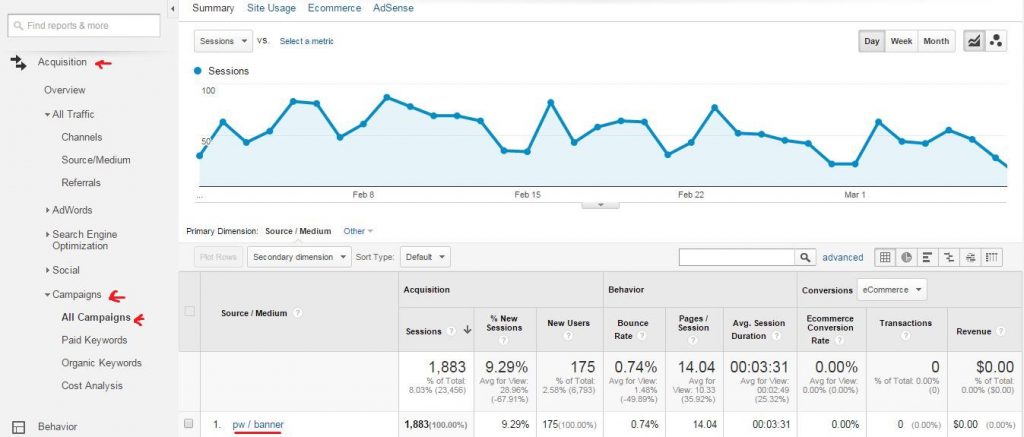
The benefit of using this custom tool is that it is easy to find the data on it without using my weird lazy Landing Page trick. The only downside is that you have to create a new one every time. This data is actually from multiple PW ads using the same URL, which makes it not as useful. But that’s my fault. This also still has the weird effect of measuring visits from readers who ORIGINALLY found you this way, even if that ad/campaign URL is no longer in use.
Summary
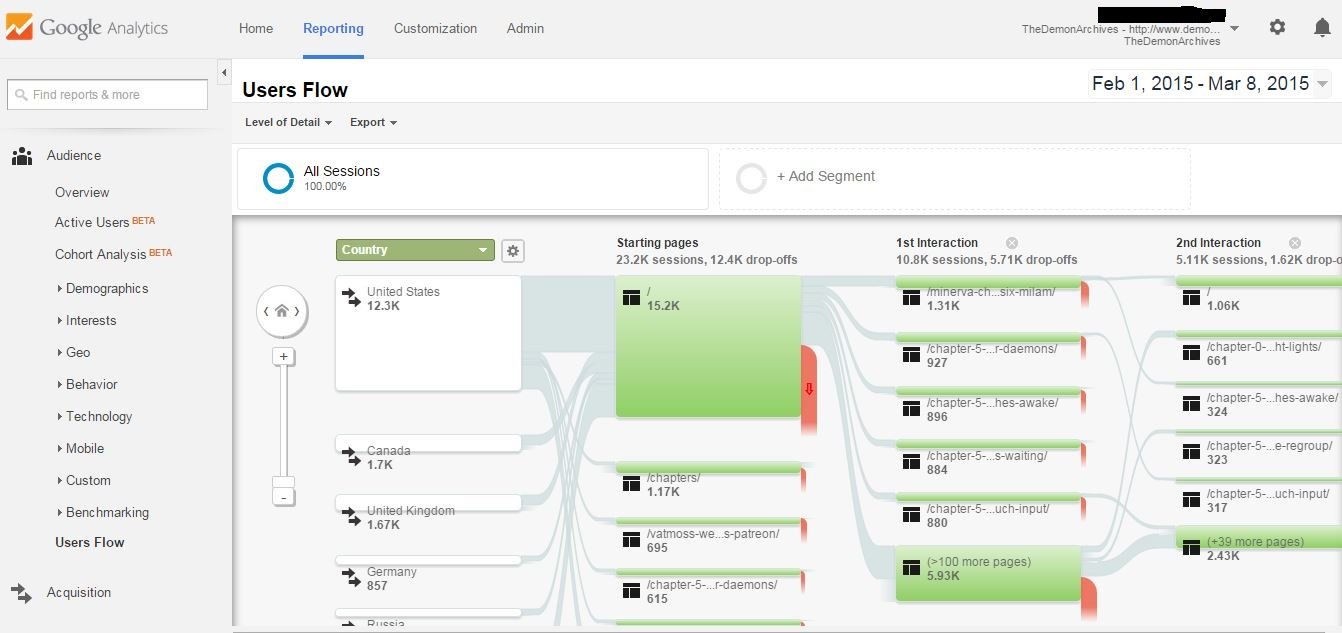
Ok, so there you have it. My tricks and tools with Google Analytics. There are many more, which I hope some of you will comment and share. Even this is only the surface of what you can do with GA. You can create goals, tie it in to commerce outcomes, and all sorts of fancy stuff. If this isn’t enough for you, check out the Behavior -> Site Content -> Landing Pages, another of my favorites, or the Audience -> Users Flow (as seen in the featured image at the top of the post) tabs for some more in depth analysis goodies.
I hope this has been decently helpful and unlocked some of the tools and benefits of Google Analytics for you. Last things from me: it’s not about comparing yourself to others, just about allowing you to measure your growth and analyze your ads and promotional activities to better improve your site. DON’T STRESS about it, k? 😀